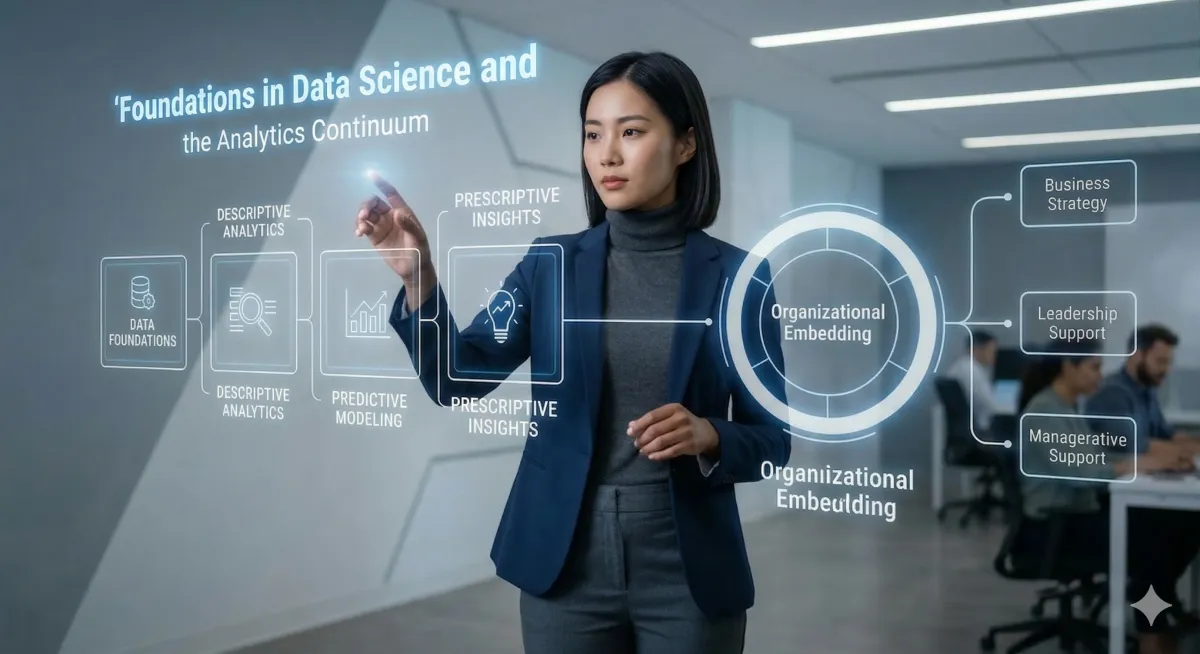
Foundations in Data Science and the Analytics Continuum
In 2012, Data Science was named the 'sexiest job of 21st century', but many organizations fail to provide the necessary infrastructure for specialists to be effective. Data Science is interdisciplinary field. Business success requires organizational embedding and a management framework.
1. Introduction: The Missing Ingredient in Data Strategy
As a product expert, I have seen this tragedy play out repeatedly: a mid-sized company with millions in revenue is driven by short-term management decisions without any clear visions, neither for the business nor the products, just to win another project. They bundle specialists into a centralized IT department, draft ambitious white papers and give them ambivalent goals. 6 months later, the initiative stalls and the management is struck completely by surprise. The destination might be clear, but the vehicle is missing.
You must understand that working output-driven on a project to deliver a an acceptable result is not enough. Technology and infrastructure are the engine, but without a chassis, you go nowhere. The solution to this stagnation is the "secret sauce": a combination of an organizational culture that enables data-driven decisions, clear management models, and specific project roles that bridge the gap between technical execution and business strategy. My purpose with this article is to transform you into an expert by mastering the technical and organizational infrastructure that allows Data Science to function as the core pillar of a modern enterprise.
2. The Analytics Continuum: From Description to Automation
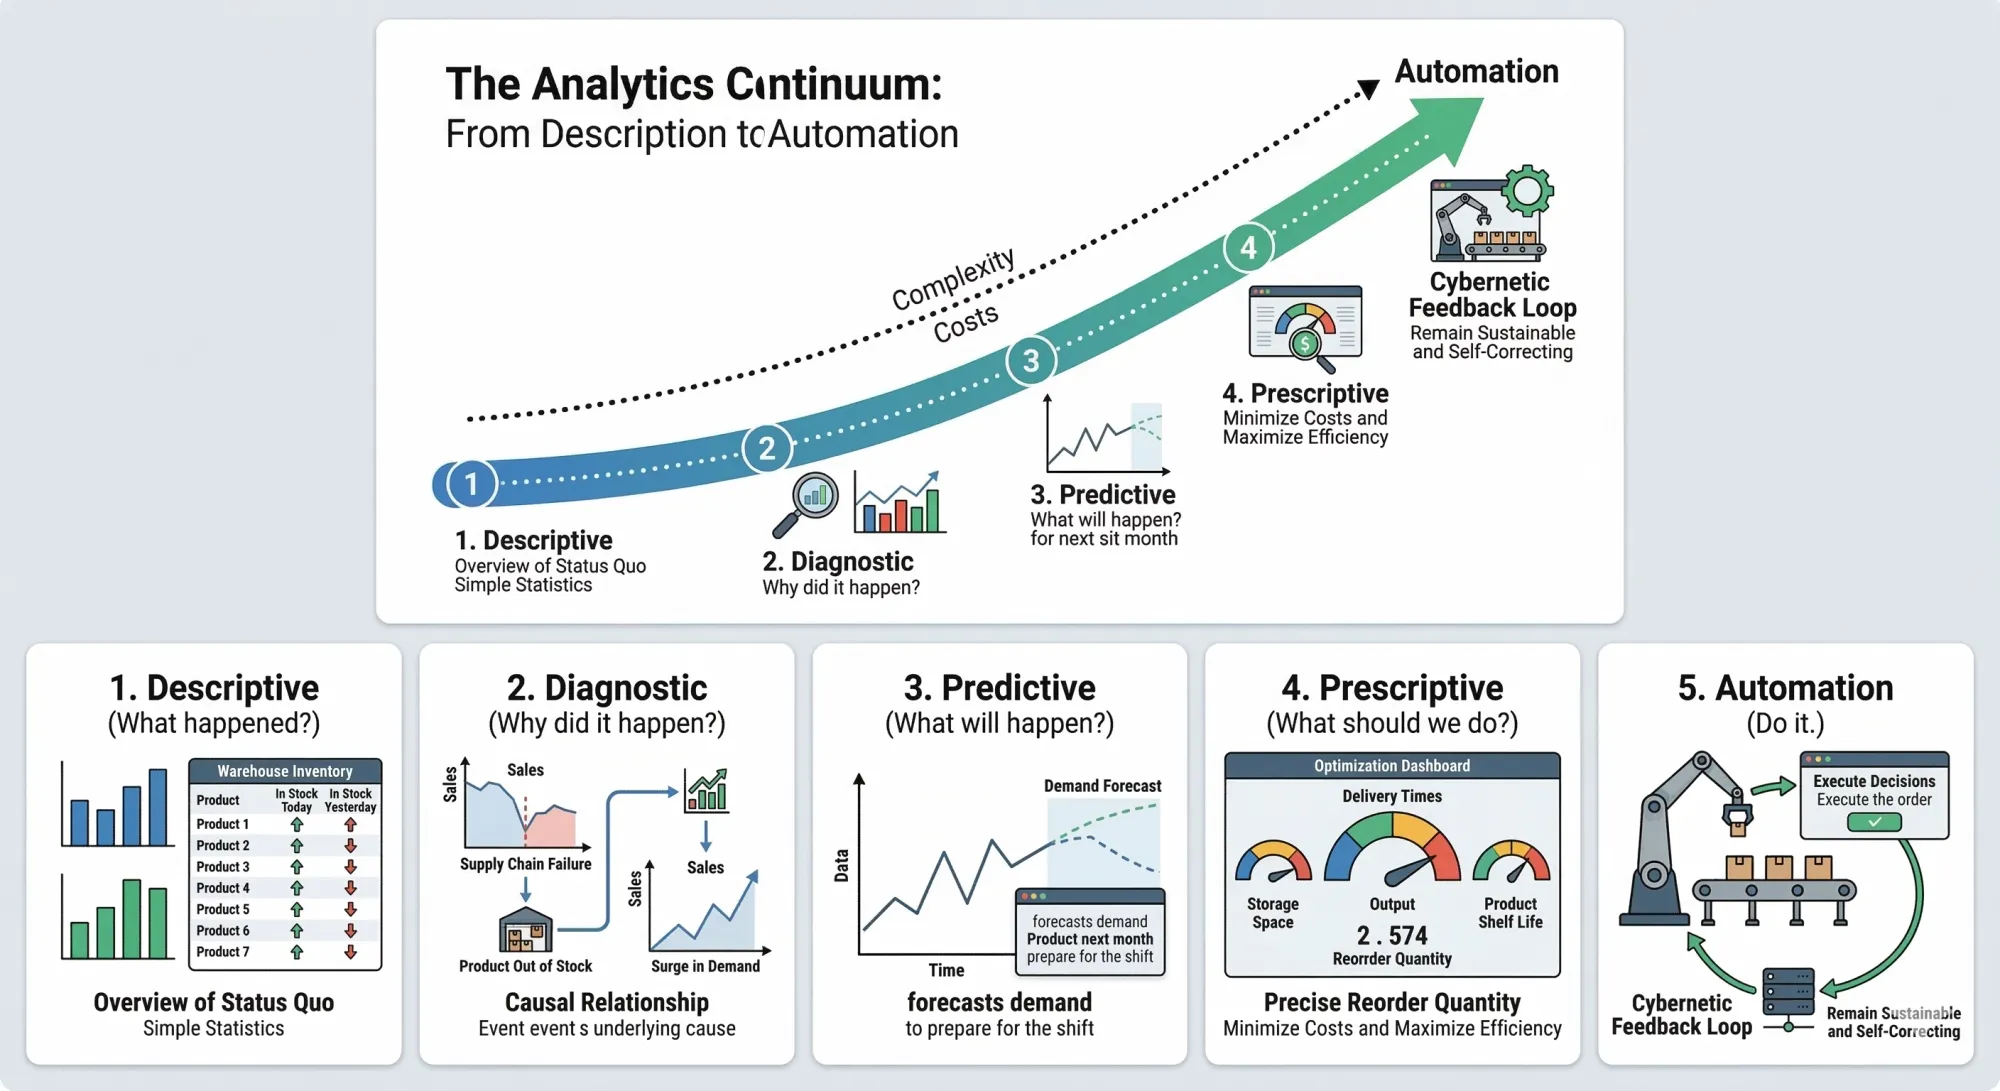
A successful strategy follows the Gartner Analytics Continuum, a roadmap from observation to autonomous action. You cannot skip steps here, as complexity and costs increase exponentially as you move toward the top. While a descriptive report might take an hour, an automated system can require months of development and a six-figure budget.
- Descriptive (What happened?): This provides an overview of the status quo using simple statistics and visuals. Consider an inventory list in a warehouse: it shows what is in stock today compared to yesterday.
- Diagnostic (Why did it happen?): Here, we look for causal relationships. If a product is out of stock, was it a supply chain failure or an unexpected surge in demand?
- Predictive (What will happen?): Once we understand causes, we can forecast. We predict the demand for a product next month so we can prepare for the shift.
- Prescriptive (What should we do?): This moves into optimization. We calculate exactly how much to reorder by balancing storage space, delivery times, and product shelf life.
- Automation (Do it.): At the pinnacle, the system executes decisions without manual intervention. This is not just "doing it," but requires a cybernetic feedback loop to remain sustainable and self-correcting.
Be warned: a common management trap is to go straight to phase 5 'automation'. To make it crystal clear: early phases can never be skipped! You need to understand first status quo (descriptive), then causality (diagnostic) before predicting and automating. Otherwise everything will be built on quicksand.
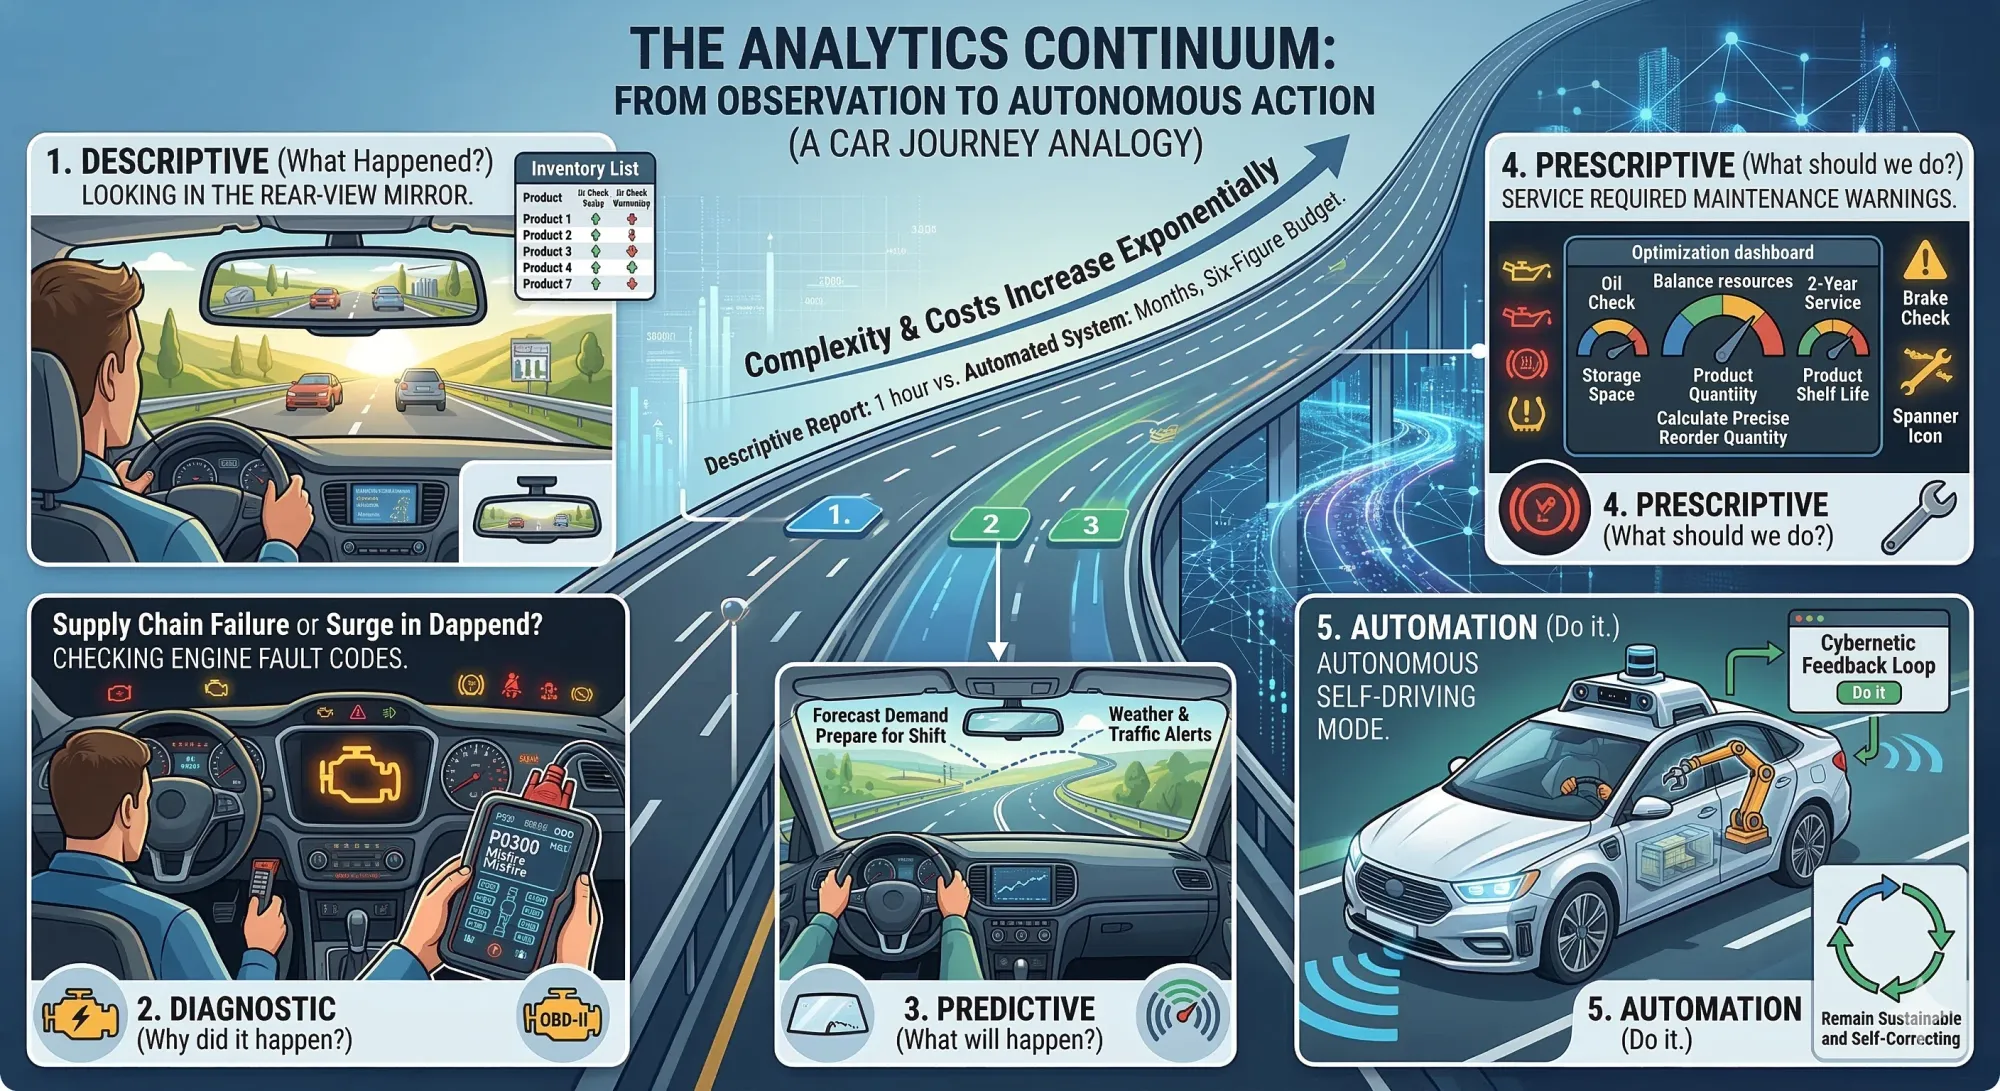
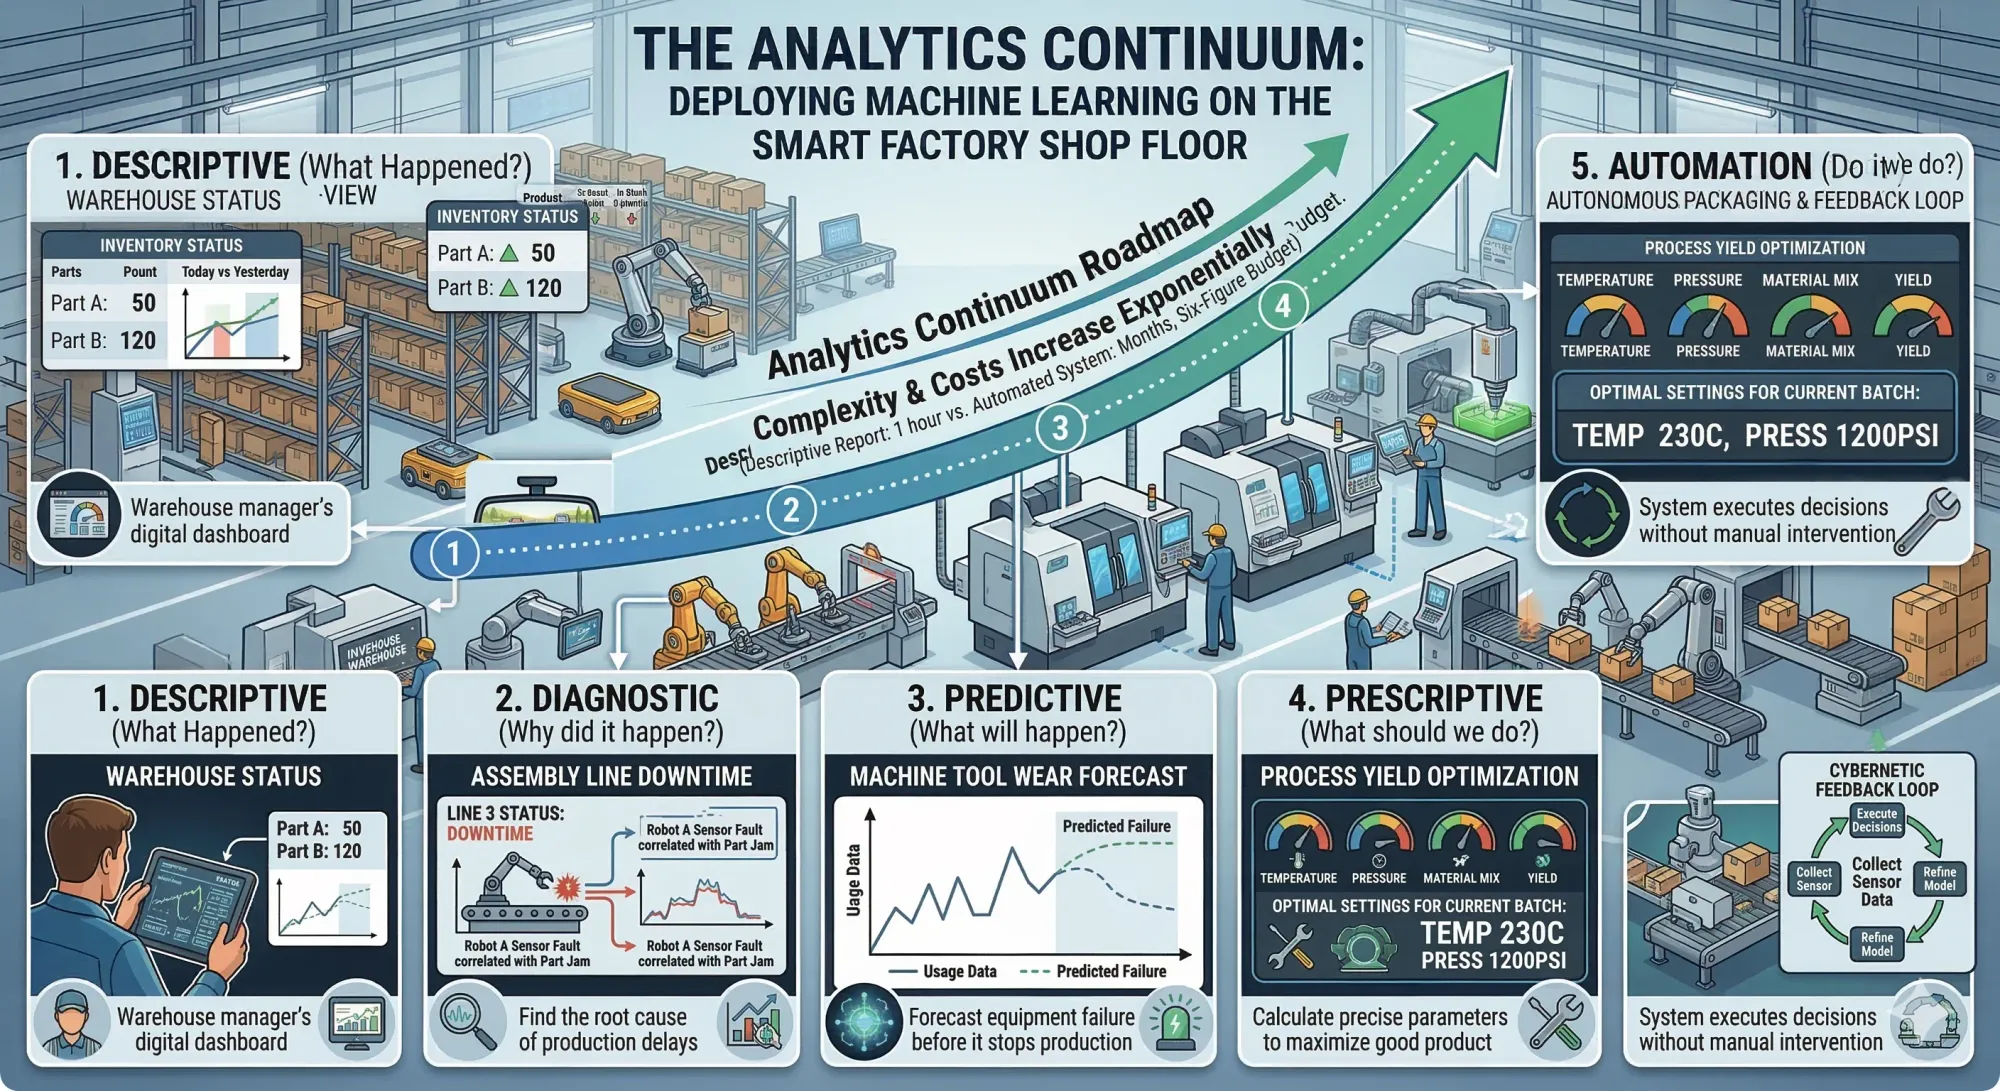
Analytics continuum explained in analogy using a car and in shop floor manufacturing
3. The 4 Pillars of Data Science Competency
Data Science is not a monolith: it is the convergence of four domains. The 2nd pillar is where most classical statisticians struggle to scale. Marcel Hebing and Martin Manhembué go beyond the traditional Venn model from Drew Conway by adding a 4th dimension; the 'social component'.
- Statistics and Mathematics: This provides the methods for descriptive insight and the calculation of abstract predictive models.
- Software Development: Modern Data Science is computationally intensive. Handling "Big Data" (Volume, Velocity, and Variety) requires distributed computing and specialized programming that classical scripting cannot handle.
- Domain Expertise: You must understand the application area. This is essential for the data preparation phase, which occupies 80 percent of a project's timeline.
- The Social Dimension: This is the "Glue" that holds the project together. Interdisciplinarity only works if there are structures to order communication between diverse stakeholders.
"Interdisciplinarity can only function if communication takes place and there are structures that order it. It requires the management of the interplay between people with their different professional backgrounds and methodical procedures."
4. Data Typology: Structured, Semi-Structured, and Unstructured
To lead an AI team, you must speak the language of data organization.
- Structured Data: Highly organized, such as SQL relational databases. Every row is an entity, and every column has a constant data type.
- Semi-Structured Data: These use hierarchical structures like JSON or XML. They are the standard for APIs, allowing for complex, nested data exchange.
- Unstructured Data: This includes text for Natural Language Processing (NLP) or multimedia like video. These require immense computing power to identify patterns.
The mathematical potential of your analysis is dictated by the scale level of the data. For instance, measuring temperature in Celsius only allows for interval-level analysis, while Kelvin, with its absolute zero point, allows for ratio-level operations, such as calculating percentages of change.
| Scale Level | Example | Frequency | Rank | Intervals | Zero Point |
|---|---|---|---|---|---|
| Nominal | Gender, Product type | X | |||
| Ordinal | Education level, Star ratings | X | X | ||
| Interval | IQ score, Year, Celsius | X | X | X | |
| Ratio | Age, Weight, Kelvin | X | X | X | X |
5. The Impact Distillery Model: A Strategic Project Lifecycle
To ensure value, follow this iterative 5-step process. Listen to these commands carefully:
- Design:
- Command: Translate the vague business problem into a specific, researchable question and calculate the required resources.
- Data:
- Command: Build the data basis by choosing between Primary (self-collected), Secondary (raw existing), or Tertiary data (aggregated statistics). Prepare the data needed to answer the research question.
- Analyse:
- Command: Select methods based on your position in the Analytics Continuum, from simple frequencies to complex Machine Learning. Apply statistical and ML methods to uncover insights.
- Doku:
- Command: Create technical documentation for reproducibility and non-technical reports or dashboards for stakeholders. You have 2 target groups to serve: documentation for technical audience, reports are for non-technical audience.
- Impact:
- Command: Measure the value. Whether the impact is monetary or qualitative, it must justify the project's existence. Turn insights into practical actions that create business value, then evaluate if those actions actually worked.
6. The Science of Data Preparation: Quality, Features, and Splits
The quality of your AI is a direct reflection of your data. We assess this through Sampling Quality, Measurement Quality, and Trust in the Source. Regarding trust, you must account for "Agenda-Setting": a study on biodiversity from a pro-animal rights group may differ significantly from one provided by an oil company due to provider bias.
The real work happens in Feature Engineering. This is 80% of the job. You must master at least three techniques:
- Handling Missing Values: Estimating gaps to prevent losing data rows.
- One-hot Encoding: Converting categorical data into binary columns.
- Normalization / Standardization: Scaling values to a standard range (e.g., mean of 0).
To validate your models, use an 80:20 Train-Test split. You train on 80% and use the remaining 20% as a final reference to check for "Overfitting." Overfitting is far more dangerous than Underfitting because it is psychologically deceptive: stakeholders falsely trust high training scores, only for the model to fail in the real world.
7. Conclusion: Beyond the Hype
We have seen a necessary shift from the raw volume of "Big Data" to the high-quality utility of "Smart Data." Success is rarely a purely technical achievement: it requires organizational embedding and a rigid management framework.
In 2012, Data Science was named the "Sexiest Job of the 21st Century." However, many organizations still fail to provide the necessary infrastructure for their specialists to be effective. As you evaluate your own organization, ask yourself: does your current strategy provide the glue, the culture, and the management models required to turn your data treasures into actual impact?
Series Parts
Data Science Management – From Concept to Governance
- Part 1: Technical Implementation (Foundation & Infrastructure)
- 1 Foundations & Data Fundamentals
- 2 Analysis & Modeling; [next]